 FB
FBChemical and Process Engineering Resources


We were concerned when a client stated that their product has a viscosity of 2000 to 3000 cP. How could we pump this material from the manufacturing tank to the filling line? Luckily, we had a plant and resources to conduct a full-scale test. The objective of the test was to pump a “placebo product” (one that had all of the viscosity building materials but none of the active ingredients) from one tank to another. We hoped to analyze data from the test and determine the “apparent viscosity” of the placebo, then compare that with laboratory measurements.
Two flow tests were conducted. Placebo product (a suspension with no active ingredient, target viscosity of 2500 cP) was pumped from a Manufacturing Tank to a Receiver. Here are the observed results:
| Parameter | Test 1 | Test 2 |
| Pump Speed | 30% | 40% |
| Temperature | 35 C | 34 C |
| Flow rate, based on load cells | 220 kg/min | 160 kg/min |
| Pressure at pump discharge | 125 kPa | 83 kPa |
| Pressure at receiver | 28 kPa | 28 kPa |
The observed values, along with knowledge of the physical piping, can be used to calculate the “apparent viscosity” of the placebo product. The piping from the pump to the Hold Tank is 50 DN (47.5 mm inside diameter). It includes straight piping, elbows, 45° bends, one divert valve and one diaphragm valve. The total equivalent length of this piping and valves is 85 m. Equivalent length is used to calculate pressure drop. The pressure gauge on the pump discharge is 1 meter higher than the one beneath the Receiver; the pressure drop due to friction is therefore P1 – P2 + 1 meter head, where P1 = pressure at pump discharge, and P2 = pressure beneath Receiver.
Estimation of Apparent Viscosity
There are three steps to calculating the pressure drop due to friction through the pipe. The first step requires fluid viscosity as an input. To calculate the viscosity, initially assume a value, proceed through the three steps, and compare the calculated pressure drop with the observed results. Iterate by changing the viscosity assumption until the calculation and observed result match.
For these calculations, a value for the placebo product density must also be known. This wasn’t measured, but plant operators stated that it is from 1.2 to 1.3; we calculated it to be 1.26.
Step 1: Reynolds Numberi
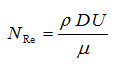 |
Eq. (1) |
ρ = density of liquid, kg/m3 or lb/ft3
D = pipe diameter, m or ft
U = average fluid velocity, m/s or ft/s = G / ρ
G = mass flux, kg/s-m2 or lb/s-ft2 = W / (3600 A)
A = cross-sectional area of pipe, m2 or ft2
μ = fluid dynamic viscosity, Pa-s or lb/ft-h (1 cP = 2.42 lb/ft-h)
Step 2: Friction Factor
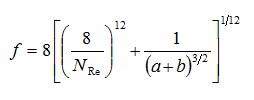 |
Eq. (2) |
Where:
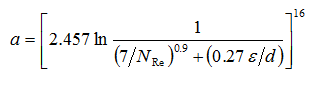 |
Eq. (3) |
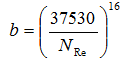 |
Eq. (4) |
ε = surface roughness, m or ft
Surface roughness is a piping characteristic. The limiting value is “smooth,” and defined to be 0.0000015 m or 0.000005 ft. For this calculation, use a value of 0.000002 m.
Step 3: Pressure Drop Due to Friction
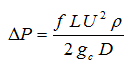 |
Eq. (5) |
L = pipe equivalent length, m or ftgc = conversion factor, 1 m/s2 or 32.17 ft/s2
| Parameter | Test 1 | Test 2 |
| Specific Gravityii | 1.26 | 1.26 |
| Observed pressure drop | 110 kPa | 68 kPa |
| Viscosity | 39 cP | 47 cP |
| Calculated pressure drop | 110 kPa | 68 kPa |
6 Comments
Very good read. I currently am working with a client in the ~400 to ~600 cP viscosity range. This analysis will be very helpful.
Mark
Please give me the Viscosity calculation in Excel sheet with various Ointment and other Viscous Material
Thank you, can you also include the schmatic diagram of the set up.
Is this excellent article available as a pdf download?
Sent it to you via PM.
Very interesting article. May I use this as a case study for teaching my fluid dynamics class?