 FB
FBChemical and Process Engineering Resources

Simply put, leaching generally refers to the removal of a substance from a solid via a liquid extraction media. The desired component diffuses into the solvent from its natural solid form. Examples of leaching include the removal of sugar from sugar beets with hot water and the removal of nickel salts or gold from their natural solid beds with sulfuric acid solutions.
There are many different types of equipment used for leaching. Most of these pieces of equipment fall into one of two categories:
Percolation ("Liquid added to solids") - The solvent is contacted with the solid in a continuous or batch method. This method is popular for in-place ore leaching or large scale "heap" leaching. Popular for extreme amounts of solids.
Dispersed Solids ("Solids added to liquid") - The solids are usually crushed into small pieces before being contacted with solvents. This is a popular leaching method when an especially high recovery rate can economically justify the typically higher operating cost (Ex/ gold extraction)
Whether the leaching is taking place via percolation or by dispersed-solids, there are three important factors that aid in leaching:  temperature, contact time/area, and solvent selection. Temperature is adjusted to optimize solubility and mass transfer.
Liquid-to-solid contact is essential for the extraction to take place and maximize contact area per unit volume reduces equipment size.  Solvent selection plays an important role in solubilities as well as the separation steps that follow leaching. Nearly all leaching equipment employs some type of agitation to aid in mass transfer and to ensure proper mixing. The most popular leaching equipment can be seen in Perry's Chemical Engineers' Handbook.
General Arrangement and Nomenclature
The following nomenclature is used in conjunction with Figure 1 below:
Sv = Mass flow of solvent
St = Mass flow of solute
Oflow = Mass flow of solvent + mass flow of solute (Overflow)
Fins = Mass flow of insoluble solids
Fsol = Mass flow of soluble solids + residual solvent (Underflow)
N = Fins / Fsol
T = Total solution flowrate
Xi = Mass fraction of solute in Oflow at a given stage
Yi = Mass fraction of solute in Fsol at a given stage
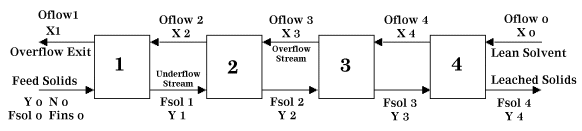 |
| Figure 1: Four Stage, Countercurrent Leaching |
Material Balance
Let's begin with a mass balance on the solute or the material that is being removed via leaching:
| Eq. (1) |
Solving for X o yields the operating line equation:
| Eq. (2) |
 Next, we perform an insoluble solids balance:
| Eq. (3) |
| N | Y |
| 2.00 | 0.00 |
| 1.97 | 0.15 |
| 1.92 | 0.21 |
| 1.86 | 0.36 |
| etc. | etc. |
At this point, we introduce the graph construction. A plot of N vs. X,Y is used to step off stages for leaching calculations. But, just as equilibrium data is necessary for a McCabe-Thiele diagram in distillation, leaching calculations require that you know something about how the solids and liquids interact.  Settling experiments can provide data such as those shown in Table 1. Essentially, N = Fins / Fsol so as more solvent is mixed with the solids, Fsol increases, N decreases, and Y increases. A plot of this data may resemble Figure 2.
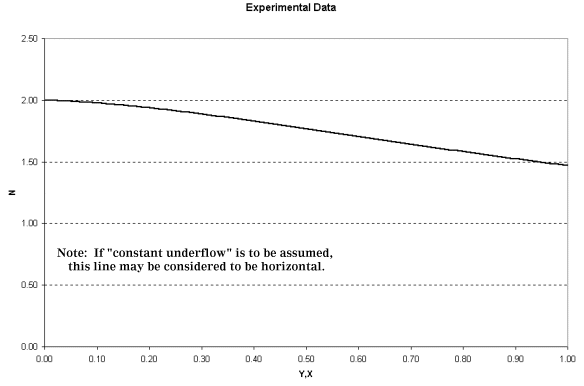 |
| Figure 2: Sample Plot of Experimental Data |
Once this data is obtained, four distinct points are known and can be plotted: Fsol o, Oflow 1, Oflow o, and T. For example, let's say that 1000 kg/h of solids, wetted with 100 kg/h of solvent, will be fed to a leaching system and of this amount 400 kg/h are soluble in the solvent. The 1500 kg/h of lean solvent coming from the separation section contains 5 wt % solute. The desired mass fraction of solute leaving the leaching system is 0.55. All of these values are determined by systems outside the leaching equipment or they are dependent on the leaching solvent, operating temperature, or particle size. For the example above, our graph would resemble Figure 3.
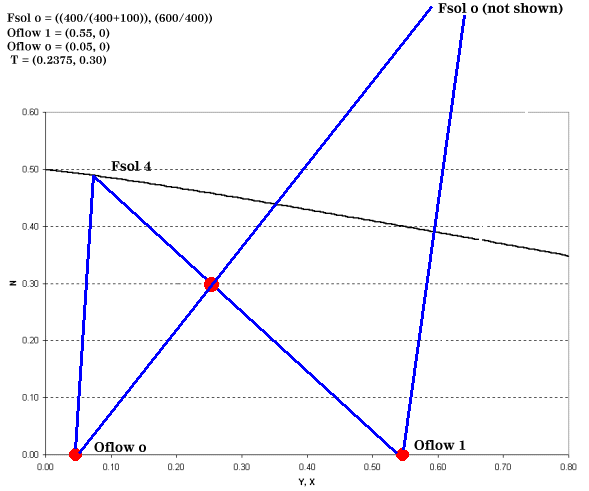 |
| Figure 3: Finding Fsol at the End of the Leaching Process |
Point T is found by:
We still have not addressed how to find the total number of stages required and intermediate solute concentrations. In order to do this, we introduce the operating point equation.
P = operating point or difference in flows
Np = N-coordinate of the operating point
Xp = X-coordinate of the operating point
| Eq. (4) |
| Eq. (5) |
| Eq. (6) |
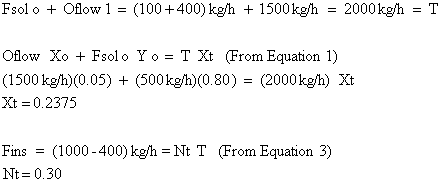
The operating point is now used to construct tie lines for the intermediate stages as shown in Figure 4.
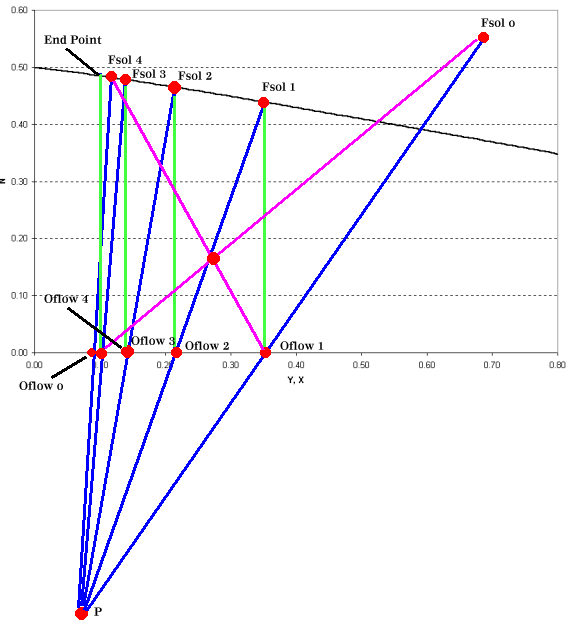 |
| Figure 4: Leaching Operating Graph for a Four Stage Leaching Operation |
Parting Word
Leaching calculations are at times confusing due to the "clumsy" nomenclature and the physical substances involved. Once you've identified the variables and the experimental data that you have and you're able to construct a graph such as Figure 3 the remaining steps are relatively simple. When constructing Figure 4, be sure that the graph scale is sufficiently large to plot the operating point, it's your guide to the remainder of the process.
Realize that to optimize a leaching process you may have to evaluate many solvents, particle sizes, operating temperatures, and feed compositions.
1 Comments