Chemical and Process Engineering Resources
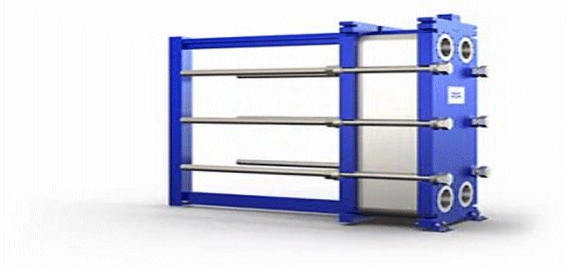
Design Charts for Plate and Frame Heat Exchangers
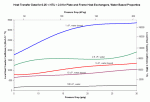
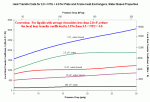
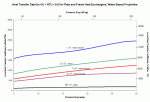
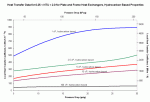
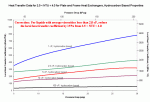
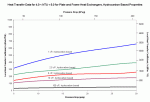
Often, in compact heat transfer technology, engineers find themselves at the mercy of the manufacturers of the equipment. For example, limited literature correlations are available to help in the preliminary design of plate and frame heat exchangers. We will introduce a series of charts that can be used for performing preliminary sizing of plate and frame exchangers. After introducing the charts, we will follow with examples to help clarify the use of the charts. The following should be noted regarding the use of the charts:
- These charts are valid for single pass units with 0.50 mm thick plates. The accuracy of the charts will not be compromised for most materials of construction.
- Wetted material thermal conductivity is taken as 8.67 Btu/h ft °F (value for SS)
- Heat transfer correlations are valid for single phase, liquid-liquid designs
- The following physical properties were used for the basis:
Table 2: Physical Property Data Used for Chart Construction Hydrocarbon-
Based FluidsWater-
Based FluidsThermal Conductivity
(Btu/h ft2 °F)0.06 0.33 Density (lb/ft3) 55 62 Heat Capacity
(Btu/lb °F)0.85 0.85 - Degree of accuracy should be within ± 15% of the service value for the overall heat transfer coefficient, assuming a nominal 10% excess heat transfer area.
- For fluids with viscosities between 100 and 500 cP, used the 100 cP line of the graphs. For fluids in excess of 500 cP, consult with manufacturers.
Download these design charts in MS Excel format from our File Repository.

 FB
FB

5 Comments
my only query is that graphs given here ,can they be used for bloc welded plate heat exchanger designing ?.
Sir,
Very nice article and very helpful.
But my query is that how these graph comes can you
sir please provide some baics about these.
Thanks
Ashish
Hindalco
These are generalized correlations that I put together when I worked for Alfa Laval. They are appropriate for early phase design.
Dear Sir,
My NTUcold is calculated to be 0.09 based on temperature difference of 4 C (37-33)C and LMTD of 40.86C. For this NTU there does not seem to be a graph.
The cooling water temperature limits are fixed here based on cooling tower's profile.