Chemical and Process Engineering Resources

Experimental
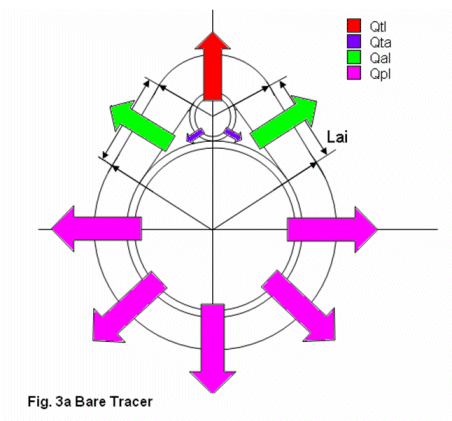
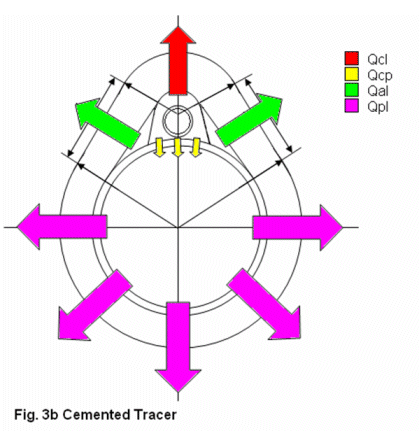
The cross sections of the bare traced and cemented traced pipes are given in Figures 3a and 3b, respectively. These figures illustrate how the geometric approach was used in describing the heat loss through the system, taking into account that spherical geometry was not assumed. |
| Figure 3a: Bare Tracer |
 |
| Figure 3b: Cemented Tracer |
| Time, s | |
| Pipe length | (0 to maximum length for steam trap), m |
| Steam pressure | (240 to 1700 kPa) |
| Nominal process fluid pipe size | (0.50 to 48 inches) |
| Number of available tracers | (0 to 5) |
| Nominal pipe size of tracer pipe | (0.50 to 0.75 inches) |
| Insulation thickness | (0 to process fluid pipe diameter), m |
| Emissivity of insulation lagging | (0 to 1) |
| Ambient temperature | (-10 to 50 °C) |
| Wind velocity | (0 to 72 km/h) |
| Annulus temperature | (Process fluid temperature to Steam Temperature) |
| Saturated steam temperature | (126.1 to 204.3 ºC) |
| Steam consumption | (0 to 50 kg/h) |
| Process fluid temperature | (0 to 600 ºC) |
| Pipe outer radius | (10.668 to 609.62 mm) |
| Pipe wall thickness | (1.3974 to 15.6869 mm) |
| Pipe inner radius | (6.401 to 1219.2 mm) |
| Pipe wall thermal conductivity | (16 to 401 W/mK) |
| Steam tracer outside radius | (6.35 to 9.53 mm) |
| Maximum tracer length | (30 to 60 m) |
| Thermal conductivity of insulation | (0.01241 to 0.1120 W/mK) |
| Average insulation temperature | (Ambient temp. to Steam temp.) |
| Surface temperature | (N/A), K |
| Surface film coefficient | (N/A), W/m2K |
The main deliverable was to obtain the minimum temperature at which the process fluid had to enter the pipeline, but other information such as the wall temperature and steam consumption were also important.
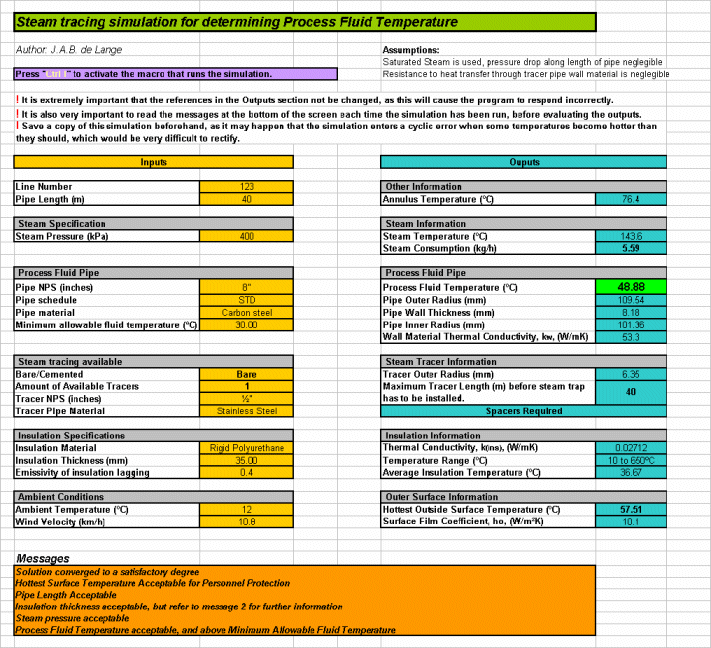
The interface designed for the simulation is shown in Fig. 3c and was written in Microsoft Excel:
 |
| Figure 3c: Interface |
The detailed design and calculations can be found in Appendix 1. The design was done following an unconventional approach, in an attempt to make as few assumptions as possible.
Most of the equations were fundamentally derived, but some equations were employed from other sources. (See References)
All the necessary equations were developed and simplified to eliminate ambiguity. The equations were then solved simultaneously and by making use of iterations.
The inputs to the simulation were highlighted in yellow, on the left side of the page, and the outputs were highlighted blue, on the right hand side, to eliminate ambiguity in deciding which were inputs and which were outputs.
The inputs section mostly made use of drop-down menus to facilitate data input, and mostly made use of referencing techniques to look up the necessary values used in the calculations. For example, the user was only required to choose the NPS of the process fluid pipe, and the schedule number, and the program automatically looked up the outer diameter, inside diameter and wall thicknesses from a table containing accurate standard values for pipe sizes.
Also, the user was only required to specify the insulation material type, steam pressure, and ambient temperature, which the program used to calculate an average insulation temperature, and interpolate between different k-values, to obtain the specific thermal conductivity at that specific temperature, since thermal conductivity is temperature dependent. The program also used the lagging emissivity, together with the ambient temperature, surface temperature and wind velocity, to calculate an exact value for the surface film coefficient on the outside, which needed to be very accurate.
The program was also able to calculate a maximum surface temperature, to ensure safety protection for personnel, as the surface temperature, by standard, is not allowed to exceed 60 ºC. Temperatures higher than this would result in injury caused by touching the outside surface.
The steam consumption was also calculated by determining the heat loss from the system for a certain length of pipe. The steam is invariably subject to heat loss, and thus condensation, when sufficient heat has been lost. This corresponds to the maximum length of a tracer. Fresh, saturated steam then needs to be re-introduced into the system, to ensure efficient operation, and a steam trap needs to be installed at the end of the maximum length, to collect all the condensate which has formed. The condensate may be recycled to create new steam.
The simulation made use of macros, in the sense that the program automatically performs the calculations necessary to converge the answers to a final answer, by simply requiring the user to press a shortcut key.

 FB
FB


3 Comments
Hi, there seem to be a discrepancy between equation 7 and equation 21 which should be the same.