Chemical and Process Engineering Resources
Results and Discussion
Due to the nature of the project, definite answers are not possible to obtain, but rather different simulations could be run and each time the answers could be evaluated. As an example, one specific run could be described in terms of its equations as follows:
Consider the Bare Tracer.
Firstly, the inputs field has to be completed (see Table 1):
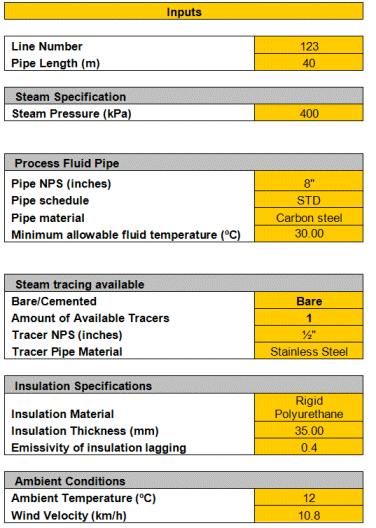 |
After this has been done, the outputs section may be calculated:
Some of the outputs are values found in making use of references from other tables. These are shown first in Table 2.
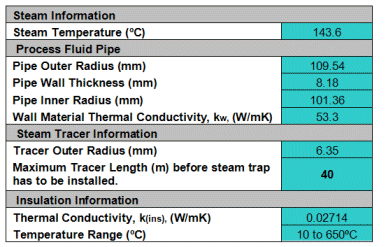 |
This information can now be used together with the inputs section to calculate the remaining outputs.
Firstly, the Average Insulation Temperature is calculated from Eq. (9):

it is found that Tins=36.67 ºC
It should be noted that the Process fluid Temperature is not known yet, so this is not a final answer.
Secondly, the Annulus Temperature may be calculated from Eq. (8):

Tann=76.4 ºC
Since Tp is not known yet, and Tins has not yet been assigned a definite value, this value is also not fixed yet.
Now, the Average Surface Temperature needs to be calculated. This value may be approximated by assuming that about 80% of the average surface temperature is due to the process fluid temperature and the remaining 20% is made up of the surface temperature on the tracer side. The Average Surface Temperature may then be calculated as follows.
From Eq.(13) and (14):

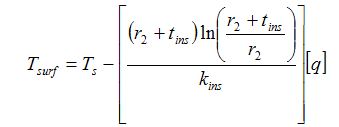 |
for the tracer side |
and
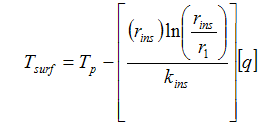 |
for the process fluid pipe side |
Therefore

The surface temperature is now calculated by making use of iterations to obtain the final value of
Tsurf-Avg = 14.991 ºC
This causes the value of q to change until it stabilizes to its final answer.
Technically speaking, one has to calculate the area ratios that the process fluid pipe, annulus length and tracer each contribute, calculate each area’s surface temperature, and obtain the average value for the surface temperature accordingly, but due to the limited capacity of Microsoft Excel, this method was tried and it failed, because Excel could not perform all the iterations necessary to do the calculations. The above calculation has shown to give satisfactory results for most situations.
As a next step, the surface coefficient needs to be calculated using Eq.(15):

The value for the surface coefficient then becomes:
h0=10.1k1 is calculated using Eq.(10):

but according to Eq.(5),

and

therefore, k1=18.21340591
k2 may then be calculated using Eq.(11):
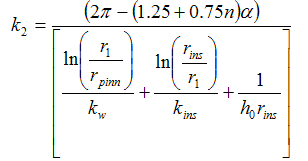
and therefore amounts to k2= 0.489641399
Finally the Process Fluid Temperature can be calculated using Eq.(12):

Excel is then programmed to perform iterations automatically, since a circular reference is created, but it causes all of the values to converge consequently, and the final answers are obtained, and with the final values of Tins known, the correct thermal conductivity values can be obtained and used in the equations:
kins = 0.02712 W/m Kkw = 53.3 W/m K
References
Le Roux, D.F. (1997) “Thermal Insulation and Heat Tracingâ€, Guideline presented by line manager D.F. le Roux, Secunda.Foo, K.W. (1994) “Sizing tracers quickly (Part 1)â€. Hydrocarbon Processing, p93-97. January. “Sizing tracers quickly (Part 2)â€. Hydrocarbon Processing, p93-97. February.
Fisch, E. (1984) “Winterising process plantsâ€. Chemical Engineering, p128-143, 20 August.
Kenny, T.M. (1992) â€Steam tracing: do it rightâ€. Chemical Engineering Progress, p40-44, August.
Coulson, J.M and Richardson, J.F. (1999) Chemical Engineering, R.K. Sinnot, London.
Le Roux, D.F. (2005) Theoretical discussion and problem description, Sasol Limited, Secunda.
Van der Spuy, E. (2005) Theoretical advice, and steam traps, Spirax Sarco, Secunda.
Smit, J. (2005) Practical information, Sasol Limited, Secunda.
Technical committee of specification SP 50-4, (2004) Specification SP 50-4 Revision 2 for Steam and Hot Water Tracing, Sasol Limited, Secunda.

 FB
FB


3 Comments
Hi, there seem to be a discrepancy between equation 7 and equation 21 which should be the same.