Chemical and Process Engineering Resources
Statistical Process Control: Process and Quality Views
Jul 14 2012 06:50 PM | Chris Haslego
SPC: X-bar Charts
Start by calculating the average for the data points: | Eq. (1) |

Now,
 | Eq. (2) Eq. (3) Eq. (4) Eq. (5) |

In a 3-sigma system, Z is equal to 3 [Equations 2 and 3] (hence its name) and a 6-sigma system uses Z=6, therefore:
UCL (calculated) = 0.65 + 3(0.0056) = 0.67
LCL (calculated) = 0.65 - 3(0.0056) = 0.63
As mentioned before the other control limits are set depending on the quality of the product needed. A-grade n-hexane must be between 0.61 and 0.69 (these are the quality limits). Typical process limits may then be 0.62 to 0.68. Now we know all of the limits for our current data:
UCL (calculated) = 0.67
UCL (process) = 0.68
UCL (quality) = 0.69
LCL (calculated) = 0.63
LCL (process) = 0.62
LCL (quality) = 0.61
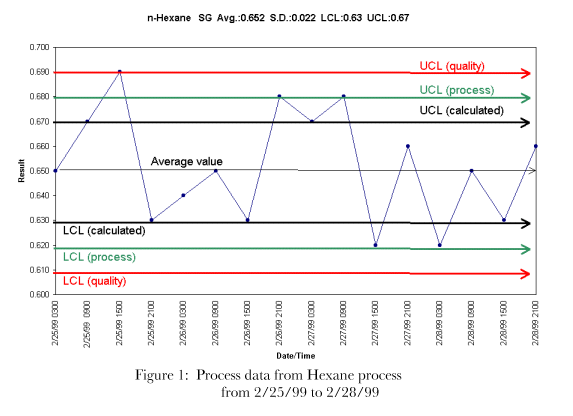
At this point, it's tempting to conclude that since the calculated limits are inside the process and quality limits, the process is operating perfectly. But let's have a look at the X-bar chart:
 |
Figure 1 shows the performance from 2/25/99 to 2/28/99. According to the definition of "in control", the process should meet four criteria:
1. No sample points outside of process limits
2. Most points near average
3. Nearly equal number of points above and below average
4. Points are randomly distributed
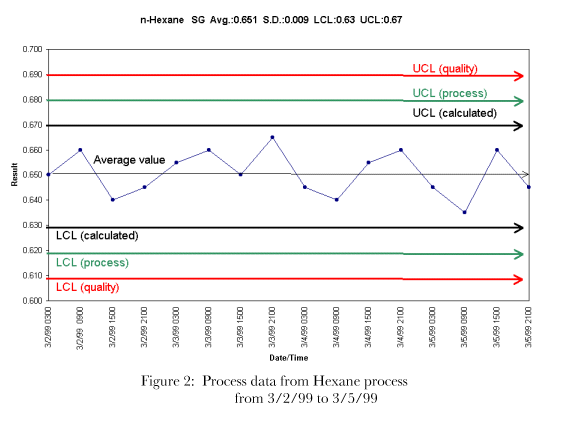
According to Figure1, only conditions 3 and 4 are being met. This process should be examined for process upsets or interruptions in stability. After the appropriate process changes were made, another X-bar chart was constructed over another 4 day period, Figure 2 below shows these results:
 |
After the process improvements, the data suggests that the process is in control and all four criteria for control are being met. Figure 2 shows how you should aim to control your process.

 FB
FB

3 Comments
Hi Thanks very much
Could you please provide me with example of daily,monthly performance report of equipment,production report, specifically the activities of process engineer with examples
I'll be so great full for you , i have solid experiences in oil and gas operation, however i am chemical engineer ,but i didn't experience engineering issue
excelente pagina, los temas son bien específicos y de muy buena calidad.
gracias a ustedes por tan maravillosa pagina y del tiempo que le dedican a cada articulo.