Chemical and Process Engineering Resources
Statistical Process Control: Process and Quality Views
Jul 14 2012 06:50 PM | Chris Haslego
SPC: R-bar Charts
R-bar charts utilize chart factors that are typically found in statistical references. Table 2 shows a portion of such a chart for 3-sigma control:
Sub-Groups |
D3 | D4 |
| 2 | 0 | 3.27 |
| 3 | 0 | 2.57 |
| 4 | 0 | 2.28 |
| 5 | 0 | 2.11 |
| 6 | 0 | 2.00 |
| 7 | 0.08 | 1.92 |
| 8 | 0.14 | 1.86 |
The UCL (calculated) are LCL (calculated) are defined by:
 | Eq. (6) Eq. (7) Eq. (8) |
where MR (moving range) is the absolute value of the difference between the current data point and the preceding data point. The number of sub-groups is an area that most people do not agree upon. For example, if you group results by week and you're analyzing data for a month you could use 4 sub-groups. As a general rule, if your continuous process has been operating under the same specifications over the time of your analysis, you may assume 2 sub-groups. This is the approach we'll use for our system.
Let's assume that our plant also produces glycol which has an average specific gravity of 1.11. An R-bar chart provides an effective means of monitoring the transition from n-hexane (SG=0.65) to glycol (SG=1.11). Monitoring the individual results (X-bar chart) in conjunction with the R-bar chart will paint a very clear picture of the transition. The data in Table 3 shows the 4-day transition. The feeds were changed just prior to this data being recorded. What we're seeing is the n-hexane leaving the system and the glycol showing up gradually.
| Date | Time | SG results | Moving Range results |
| 3/15/99 | 0300 | 0.65 | --- |
| Â | 0900 | 0.63 | 0.02 |
| 1500 | 0.67 | 0.04 | |
| 2100 | 0.74 | 0.07 | |
| 3/16/99 | 0300 | 0.77 | 0.03 |
| Â | 0900 | 0.82 | 0.05 |
| 1500 | 0.95 | 0.13 | |
| 2100 | 0.99 | 0.04 | |
| 3/17/99 | 0300 | 1.02 | 0.03 |
| Â | 0900 | 1.10 | 0.08 |
| 1500 | 1.08 | 0.02 | |
| 2100 | 1.13 | 0.05 | |
| 3/18/99 | 0300 | 1.10 | 0.03 |
| Â | 0900 | 1.08 | 0.02 |
| 1500 | 1.07 | 0.01 | |
| 2100 | 1.10 | 0.03 |
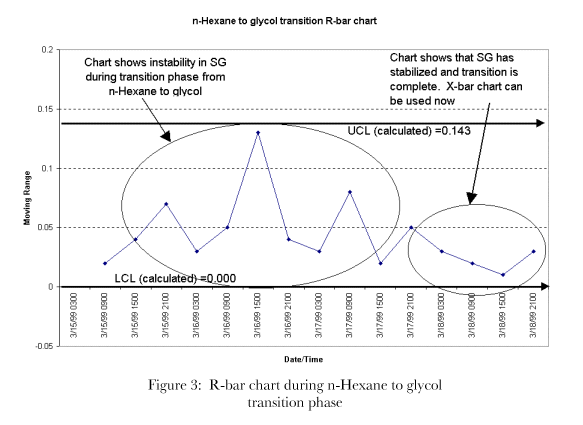
Now, to form the R-bar chart, we graph the data/time versus the moving range. We can assume 2 sub-groups (n-hexane and glycol over a short period of time). The moving range for 3/15/99 at 0900 was calculated by |(0.63-0.65)|=0.02. Typically, there will be no process or quality control limits for R-bar charts. For this transition:

UCL(calculated) = (3.27)(0.043) = 0.14
LCL(calculated) = (0)(0.043) = 0.00
Figure 3 shows the R-bar chart for the transition from n-hexane to glycol. While using an X-bar chart alone during times of change in a system is feasible, it is sometimes difficult to graph the data due to the potentially large differences in results. Another consideration is that in data compiling, a R-bar chart appearing between X-bar charts is a nice way to show a transition phase has occurred. R-bar charts are also useful when plotting data over a large time span. To show the contrast in the two types of charts, the x-bar chart during the transition is shown in Figure 4.
  |
The arrow in Figure 4 shows the point at which the SG of the glycol has entered the quality control range. This is a very important point because the system output must be directed to a glycol storage tank at this point (rather than the waste container used during the transition). This is why the charts should be used in conjunction with one another, and an R-bar chart should not be used alone during a transition.
Uses of R-bar charts include:
1. Keep a record of when process changes or feed changes occurred
2. Record of how long the process took to stabilize
3. Show long history of a process or piece of equipment
If or whenever you use R-bar charts, remember that they tell you nothing about the actual value of the results, only deviations from one result to the next.

 FB
FB

3 Comments
Hi Thanks very much
Could you please provide me with example of daily,monthly performance report of equipment,production report, specifically the activities of process engineer with examples
I'll be so great full for you , i have solid experiences in oil and gas operation, however i am chemical engineer ,but i didn't experience engineering issue
excelente pagina, los temas son bien específicos y de muy buena calidad.
gracias a ustedes por tan maravillosa pagina y del tiempo que le dedican a cada articulo.