Chemical and Process Engineering Resources
Basic Concepts of Pinch Analysis
Most industrial processes involve transfer of heat either from one process stream to another process stream (interchanging) or from a utility stream to a process stream. In the present energy crisis scenario all over the world, the target in any industrial process design is to maximize the process-to-process heat recovery and to minimize the utility (energy) requirements. To meet the goal of maximum energy recovery or minimum energy requirement (MER) an appropriate heat exchanger network (HEN) is required. The design of such a network is not an easy task considering the fact that most processes involve a large number of process and utility streams. As explained in the previous section, the traditional design approach has resulted in networks with high capital and utility costs. With the advent of pinch analysis concepts, the network design has become very systematic and methodical.
A summary of the key concepts, their significance, and the nomenclature used in pinch analysis is given below:
- Combined (Hot and Cold ) Composite Curves: Used to predict targets for:
- Minimum energy (both hot and cold utility) required,
- Minimum network area required, and
- Minimum number of exchanger units required.
- DTmin and Pinch Point: The DTmin value determines how closely the hot and cold composite curves can be ‘pinched’ (or squeezed) without violating the Second Law of Thermodynamics (none of the heat exchangers can have a temperature crossover).
- Grand Composite Curve: Used to select appropriate levels of utilities (maximize cheaper utilities) to meet over all energy requirements.
- Energy and Capital Cost Targeting: Used to calculate total annual cost of utilities and capital cost of heat exchanger network.
- Total Cost Targeting: Used to determine the optimum level of heat recovery or the optimum DTmin value, by balancing energy and capital costs. Using this method, it is possible to obtain an accurate estimate (within 10 - 15%) of overall heat recovery system costs without having to design the system. The essence of the pinch approach is the speed of economic evaluation.
- Plus/Minus and Appropriate Placement Principles: The "Plus/Minus" Principle provides guidance regarding how a process can be modified in order to reduce associated utility needs and costs. The Appropriate Placement Principles provide insights for proper integration of key equipments like distillation columns, evaporators, furnaces, heat engines, heat pumps, etc. in order to reduce the utility requirements of the combined system.
- Total Site Analysis: This concept enables the analysis of the energy usage for an entire plant site that consists of several processes served by a central utility system.
With further research, new topics like ‘Regional Energy Analysis’, ‘Network Pinch’, ‘Top Level Analysis’, ‘Optimisation of Combined Heat & Power’, ‘Water Pinch’, and ‘Hydrogen Pinch’ are being developed. These basic terms and concepts have become the foundation of what we now call Pinch Technology.
Steps of the Pinch Analysis
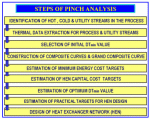
In any Pinch Analysis problem, whether a new project or a retrofit situation, a well-defined stepwise procedure is followed (Figure 3). It should be noted that these steps are not necessarily performed on a once-through basis, independent of one another. Additional activities such as re-simulation and data modification occur as the analysis proceeds and some iteration between the various steps is always required.
 |
| Figure 3: Steps in Pinch Analysis |
Step 1: Identification of the Hot, Cold and Utility Streams in the Process
- ‘Hot Streams’ are those that must be cooled or are available to be cooled. e.g. product cooling before storage
- ‘Cold Streams’ are those that must be heated e.g. feed preheat before a reactor.
- ‘Utility Streams’ are used to heat or cool process streams, when heat exchange between process streams is not practical or economic. A number of different hot utilities (steam, hot water, flue gas, etc.) and cold utilities (cooling water, air, refrigerant, etc.) are used in industry.
The identification of streams needs to be done with care as sometimes, despite undergoing changes in temperature, the stream is not available for heat exchange. For example, when a gas stream is compressed the stream temperature rises because of the conversion of mechanical energy into heat and not by any fluid to fluid heat exchange. Hence such a stream may not be available to take part in any heat exchange. In the context of pinch analysis, this stream may or may not be considered to be a process stream.
Step 2: Thermal Data Extraction for Process & Utility Streams
For each hot, cold and utility stream identified, the following thermal data is extracted from the process material and heat balance flow sheet:
- Supply temperature (TS °C) : the temperature at which the stream is available.
- Target temperature (TT °C) : the temperature the stream must be taken to.
- Heat capacity flow rate (CP kW/ °C) : the product of flow rate (m) in kg/sec and specific heat (Cp kJ/kg °C).
CP = m x Cp - Enthalpy Change (dH) associated with a stream passing through the exchanger is given by the First Law of Thermodynamics:
First Law energy equation: d H = Q ± W
In a heat exchanger, no mechanical work is being performed:
W = 0 (zero)
The above equation simplifies to: d H = Q, where Q represents the heat supply or demand associated with the stream. It is given by the relationship: Q= CP x (TS - TT).
Enthalpy Change, dH = CP x (TS - TT)
** Here the specific heat values have been assumed to be temperature independent within the operating range.
The stream data and their potential effect on the conclusions of a pinch analysis should be considered during all steps of the analysis. Any erroneous or incorrect data can lead to false conclusions. In order to avoid mistakes, the data extraction is based on certain qualified principles.
| Stream Number | Stream Name | Supply Temp (°C) | Target Temp (°C) | Heat Cap Flow (kW/°C) | Enth. Change (kW) |
| 1 | Feed | 60 | 205 | 20 | 2900 |
| 2 | Reac. Out | 270 | 160 | 18 | 1980 |
| 3 | Product | 220 | 70 | 35 | 5250 |
| 4 | Recycle | 160 | 210 | 50 | 2500 |
Step 3: Selection of the Initial DTmin Value
The design of any heat transfer equipment must always adhere to the Second Law of Thermodynamics that prohibits any temperature crossover between the hot and the cold stream i.e. a minimum heat transfer driving force must always be allowed for a feasible heat transfer design. Thus the temperature of the hot and cold streams at any point in the exchanger must always have a minimum temperature difference (DTmin). This DTmin value represents the bottleneck in the heat recovery.
In mathematical terms, at any point in the exchanger:
 Hot stream Temp. ( TH ) - ( TC ) Cold stream Temp. >= DTmin |
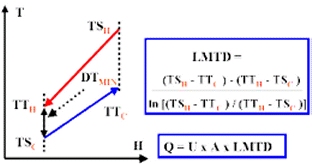
The value of DTmin is determined by the overall heat transfer coefficients (U) and the geometry of the heat exchanger. In a network design, the type of heat exchanger to be used at the pinch will determine the practical Dtmin for the network. For example, an initial selection for the Dtmin value for shell and tubes may be 3-5 0C (at best) while compact exchangers such as plate and frame often allow for an initial selection of 2-3 0C. The heat transfer equation, which relates Q, U, A and LMTD (Log Mean Temperature Difference) is depicted in Figure 4.
 |
| Figure 4: The Heat Transfer Equation |
For a given value of heat transfer load (Q), if smaller values of DTmin are chosen, the area requirements rise. If a higher value of DTmin is selected the heat recovery in the exchanger decreases and demand for external utilities increases. Thus, the selection of DTmin value has implications for both capital and energy costs. This concept will become clearer with the help of composite curves and total cost targeting discussed later.
Just as for a single heat exchanger, the choice of DTmin (or approach temperature) is vital in the design of a heat exchanger networks. To begin the process an initial DTmin value is chosen and pinch analysis is carried out. Typical DTmin values based on experience are available in literature for reference. A few values based on Linnoff March’s application experience are tabulated below for shell and tube heat exchangers.
| No | Industrial Sector | Experience DTmin Values |
| 1 | Oil Refining | 20-40 °C |
| 2 | Petrochemical | 10-20 °C |
| 3 | Chemical | 10-20 °C |
| 4 | Low Temp Processes | 3-5 °C |
Step 4: Construction of the Composite Curves and Grand Composite Curve
- COMPOSITE CURVES: Temperature - Enthalpy (T - H) plots known as ‘Composite curves’ have been used for many years to set energy targets ahead of design. Composite curves consist of temperature (T) – enthalpy (H) profiles of heat availability in the process (the hot composite curve) and heat demands in the process (the cold composite curve) together in a graphical representation.

 FB
FB


0 Comments