Chemical and Process Engineering Resources
Pressure Drop Predicition
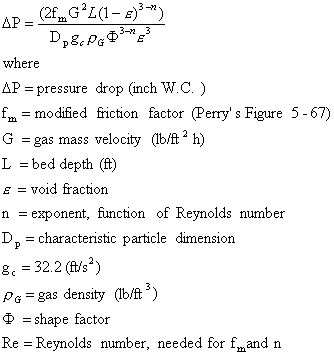
When packed towers were initially introduced as mass transfer devices, the dry gas pressure drop across them was the first criterion which was evaluated and work by Ergun and Leva resulted in a correlation for dry bed pressure drop of the following form:
Â
 |
A detailed definition of Equation 1 can be found in Perry''s Chemical Engineers'' Handbook, 6th Edition. For packed towers using large size packing, the flow is generally turbulent, which results in "n" being equal to 2. Equation 1 can thus be simplified to:
C2 combines the constants of Equation 1 and the characteristic packing dimension Dp.
Tower packings typically have a void fraction of 0.6 to 0.8, which makes the void fraction term in the denominator very significant. The gas velocity G can be replaced by the empty tower approach velocity, V. The term V/![]() gives the interstitial gas velocity in the tower Va so that Equation 2 can be re-written as:
gives the interstitial gas velocity in the tower Va so that Equation 2 can be re-written as:
Introducing a characteristic term Fs, where
 |
results in
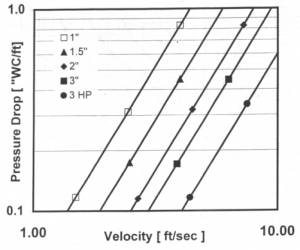
Figure 4 shows dry bed pressure drop curves for a variety of packings. These curves are based on both plant measurements and published data, but differ from handbook information in that the data have been adjusted to apply to full sized towers. The correction to the data has resulted in significantly higher pressure losses for the larger
 |
| Figure 4: Pressure Drop vs. Gas Velocity for Industrial Towers (Click to Enlarge) |
packings. It is seen that each packing has an associated constant to express the relationship between the pressure drop and the gas velocity.
As already mentioned and shown in Figure 3![]() , irrigating the packing with liquid results in liquid filling part of the void space and constricting the passages for gas flow. Leva introduced an exponential term for this phenomenon from experimental pressure drop data and CECEBE has continued with this approach and has further refined the equations based on full scale plant measurements. The equation resulting from this evaluation for the liquid correction is the following:
, irrigating the packing with liquid results in liquid filling part of the void space and constricting the passages for gas flow. Leva introduced an exponential term for this phenomenon from experimental pressure drop data and CECEBE has continued with this approach and has further refined the equations based on full scale plant measurements. The equation resulting from this evaluation for the liquid correction is the following:
Â
| LC = exp (C3 VL) |
Â
where
LC = "Liquid Correction" factor associated with irrigation below the loading point
VL = irrigation rate (ft/s) based on an empty tower
C3 = packing specific constant
The irrigated packing pressure drop is then,
Â
 |
Values of C2 and C3 for various packings were developed by correcting published pilot tower data for the smaller void fractions expected in full sized towers. The results are shown in Table 1.
The above constants and Equation 7 apply to the irrigation region below the "loading point".
When pressure drop curves for irrigated packing are examined, initially the liquid hold-up is solely dependent on the irrigation rate and the packing characteristics and this is shown by the irrigated pressure drop curves which parallel the dry bed pressure drop curve on the logarithmetric plot. As the gas velocity is increased beyond a critical value, the "loading point", the pressure drop rises more rapidly as the flow of liquid through the packing is impeded by the upward high velocity gas flow.
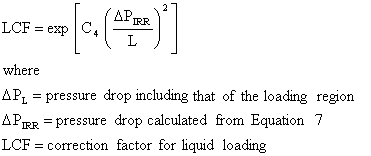
It is possible, from published data, to develop a correction method for the increase in pressure drop due to liquid loading and, based on the pressure drop calculated on the basis of no loading, to make a reasonable estimate of the pressure drop in the lower part of the loading region. When the calculated pressure drop rises well above one inch per foot, however, the tower may or may not flood, either locally or totally, such that a further extension of the proposed loading correction needs to be treated with caution. These comments apply to the large saddle packing, which is almost impossible to flood under industrial conditions. Massive acid carry-over to the mist eliminators would normally make a tower inoperable well before it floods. As is the case for the effect of irrigation, an exponential function is likely to best fit the data and a relationship can be formulated as follows.
and
 |
The relationship between the square of the irrigated pressure drop and the correction factor for the loading region is based on data from the standard saddle but should apply in general. For the HPTM and other saddles, the best estimate is that C4 is equal to 1.6. For this numerical value of C4, the pressure drop in the loading regime rises sharply as the calculated irrigated pressure drop rises beyond 0.6" W.C. per foot.
The complete CECEBE correlation for the irrigated packing pressure drop in large towers at a pressure drop of 1" W.C. per foot of packing or less can now be written as:
 |
For clean HPTM packing in a large tower, ![]() is 0.75.
is 0.75.
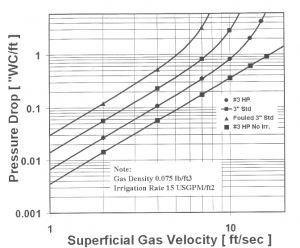
Figure 5 is a plot of Equation 10 of pressure drop in a tower as a function of superficial gas velocity for HPTM saddle packing and standard 3" saddle packing. For a given superficial gas velocity, say 5 ft/s, the savings is pressure drop in replacing standard 3" saddles with HPTM saddles will exceed 50%. Alternatively, for a given pressure drop, say 0.4" W.C./ft, the superficial velocity can be increased by over 40% flow rate.
 |
| Figure 5: Plot of Equation 10 for Several Packings |
This CECEBE HPTM design correlation has been verified through measurements in a number of large acid towers operating with gas velocities in excess of 10 ft/s. Separate measurements were made for the pressure drop in the tower nozzles and packing support. It should be noted that data with pressure drop above 0.6" W.C. is very limited. At present, it is not recommended to design a new tower to operate in the loading zone. The proposed correlations are useful, however, to assess the effect of fouling and to analyze the performance of a tower which is asked to accommodate an increase in production.
Additional plant operating data would be very useful to confirm or adjust the constants used for the proposed correlation. Since the Florida fertilizer industry has many acid towers in operation, there is probably no better source for both, realistic evaluations of the packing pieces needed per unit volume, and the pressure losses under plant conditions. Where new packings are used, the background equations also offer an opportunity for comparison with other packings in similar sized towers.
The rise in pressure drop due to irrigation and loading can also be used to assess the associated liquid hold-up. As the gas velocity increases, the kinetic energy in the gas allows liquid to be entrained by the gas and to be carried up to the next packing layer, thereby increasing the "apparent" internal irrigation rate between packing layers. This mechanism will increase significantly the liquid hold-up and the gas velocity in the bed, and the pressure drop will rise as illustrated in the previous section. Operation in the loading regime is normally avoided because good design techniques for this region are lacking. With good pressure drop data, it is possible to evaluate this phenomenon is more detail and perhaps extend the design and operating limits of packed towers.
Since the increase in gas pressure drop is associated with a reduction in the void fraction by liquid hold-up, it is also possible, by using the basic equations, to calculate the actual void fractions for operating towers and deduce both hold-up of liquid and fouling with packing chips or sulfate. In this case, void fraction is the gas space free of packing, liquid hold-up, and fouling deposits. Having available pressure drop data, gas and liquid flow rates and gas density allows the calculation of ![]() from Equation 10.
from Equation 10.

 FB
FB

0 Comments