Chemical and Process Engineering Resources
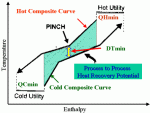
For heat exchange to occur from the hot stream to the cold stream, the hot stream cooling curve must lie above the cold stream-heating curve. Because of the ‘kinked’ nature of the composite curves (Figure 6), they approach each other most closely at one point defined as the minimum approach temperature (DTmin). DTmin can be measured directly from the T-H profiles as being the minimum vertical difference between the hot and cold curves. This point of minimum temperature difference represents a bottleneck in heat recovery and is commonly referred to as the "Pinch". Increasing the DTmin value results in shifting the of the curves horizontally apart resulting in lower process to process heat exchange and higher utility requirements. At a particular DTmin value, the overlap shows the maximum possible scope for heat recovery within the process. The hot end and cold end overshoots indicate minimum hot utility requirement (QHmin) and minimum cold utility requirement (QCmin), of the process for the chosen DTmin.
 | Â |  |
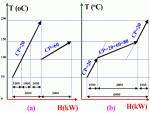
| Figure 5: Temperature-Enthalpy Relations Used to Construct Composite Curves | Â | Figure 6: Combined Composite Curves |
Thus, the energy requirement for a process is supplied via process to process heat exchange and/or exchange with several utility levels (steam levels, refrigeration levels, hot oil circuit, furnace flue gas, etc.).
Graphical constructions are not the most convenient means of determining energy needs. A numerical approach called the "Problem Table Algorithm" (PTA) was developed by Linnhoff & Flower (1978) as a means of determining the utility needs of a process and the location of the process pinch. The PTA lends itself to hand calculations of the energy targets.Â
To summarize, the composite curves provide overall energy targets but do not clearly indicate how much energy must be supplied by different utility levels. The utility mix is determined by the Grand Composite Curve.
- GRAND COMPOSITE CURVE (GCC): In selecting utilities to be used, determining utility temperatures, and deciding on utility requirements, the composite curves and PTA are not particularily useful. The introduction of a new tool, the Grand Composite Curve (GCC), was introduced in 1982 by Itoh, Shiroko and Umeda. The GCC (Figure 7) shows the variation of heat supply and demand within the process. Using this diagram the designer can find which utilities are to be used. The designer aims to maximize the use of the cheaper utility levels and minimize the use of the expensive utility levels. Low-pressure steam and cooling water are preferred instead of high-pressure steam and refrigeration, respectively.
The information required for the construction of the GCC comes directly from the Problem Table Algorithm developed by Linnhoff & Flower (1978). The method involves shifting (along the temperature [Y] axis) of the hot composite curve down by ½ DTmin and that of cold composite curve up by ½ DTmin. The vertical axis on the shifted composite curves shows process interval temperature. In other words, the curves are shifted by subtracting part of the allowable temperature approach from the hot stream temperatures and adding the remaining part of the allowable temperature approach to the cold stream temperatures. The result is a scale based upon process temperature having an allowance for temperature approach (DTmin). The Grand Composite Curve is then constructed from the enthalpy (horizontal) differences between the shifted composite curves at different temperatures. On the GCC, the horizontal distance separating the curve from the vertical axis at the top of the temperature scale shows the overall hot utility consumption of the process.
 |
| Figure 7: Grand Composite Curve |
Figure 7 shows that it is not necessary to supply the hot utility at the top temperature level. The GCC indicates that we can supply the hot utility over two temperature levels TH1 (HP steam) and TH2 (LP steam). Recall that, when placing utilities in the GCC, intervals, and not actual utility temperatures, should be used. The total minimum hot utility requirement remains the same: QHmin = H1 (HP steam) + H2 (LP steam). Similarly, QCmin = C1 (Refrigerant) +C2 (CW). The points TH2 and TC2 where the H2 and C2 levels touch the grand composite curve are called the "Utility Pinches." The shaded green pockets represent the process-to-process heat exchange.
In summary, the grand composite curve is one of the most basic tools used in pinch analysis for the selection of the appropriate utility levels and for targeting of a given set of multiple utility levels. The targeting involves setting appropriate loads for the various utility levels by maximizing the least expensive utility loads and minimizing the loads on the most expensive utilities.
Step 5: Estimation of Minimum Energy Cost Targets
Once the DTmin is chosen, minimum hot and cold utility requirements can be evaluated from the composite curves. The GCC provides information regarding the utility levels selected to meet QHmin and QCmin requirements.
If the unit cost of each utility is known, the total energy cost can be calculated using the energy equation given below.
 | Eq. (1) |
where QU = Duty of utility, kW, CU = Unit cost of utility U, $/kW per year, and U = Total number of utilities used.
Step 6: Estimation of Heat Exchanger Network ( HEN ) Capital Cost Targets
The capital cost of a heat exchanger network is dependent upon three factors:
- the number of exchangers,
- the overall network area,
- the distribution of area between the exchangers
Pinch analysis enables targets for the overall heat transfer area and minimum number of units of a heat exchanger network (HEN) to be predicted prior to detailed design. It is assumed that the area is evenly distributed between the units. The area distribution cannot be predicted ahead of design.
- AREA TARGETING: The calculation of surface area for a single counter-current heat exchanger requires the knowledge of the temperatures of streams in and out (dTLM i.e. Log Mean Temperature Difference or LMTD), overall heat transfer coefficient (U-value), and total heat transferred (Q). The area is given by the relation:
 | Eq. (2) |
 |
| Figure 8: HEN AREA min Estimation from Composite Curves |
The composite curves can be divided into a set of adjoining enthalpy intervals such that within each interval, the hot and cold composite curves do not change slope. Here the heat exchange is assumed to be "vertical" (pure counter-current heat exchange). The hot streams in any enthalpy interval, at any point, exchanges heat with the cold streams at the temperature vertically below it. The total area of the HEN (Amin) is given by the formula in Figure 8, where i denotes the ith enthalpy and interval j denotes the jth stream and dTLM denotes LMTD in the ith interval.
The actual HEN total area required is generally within 10% of the area target as calculated above. With inclusion of temperature correction factors area targeting can be extended to non counter-current heat exchange as well
- NUMBER OF UNITS TARGETING: For the minimum number of heat exchanger units (Nmin) required for MER (minimum energy requirement or maximum energy recovery), the HEN can be evaluated prior to HEN design by using a simplified form of Euler’s graph theorem. In designing for the minimum energy requirement (MER), no heat transfer is allowed across the pinch and so a realistic target for the minimum number of units (NminMER) is the sum of the targets evaluated both above and below the pinch separately.
| Eq. (3) |
Where Nh = Number of hot streams, Nc=Number of cold streams, Nu = Number of utility streams, AP / BP : Above / Below Pinch
- HEN TOTAL CAPITAL COST TARGETING: The targets for the minimum surface area (Amin) and the number of units (Nmin) can be combined together with the heat exchanger cost law to determine the targets for HEN capital cost (CHEN). The capital cost is annualized using an annualization factor that takes into account interest payments on borrowed capital. The equation used for calculating the total capital cost and exchanger cost law is given below.
| Eq. (4) |
where a, b, and c are constants in the heat exchanger cost law, Exchanger cost ($) = a + b(Area)c
For the Exchanger Cost Equation shown above, typical values for a carbon steel shell and tube exchnager would be a = 16,000, b = 3,200, and c = 0.7. The installed cost can be considered to be 3.5 times the purchased cost given by the Exchanger Cost Equation.

 FB
FB


0 Comments